Hi everyone
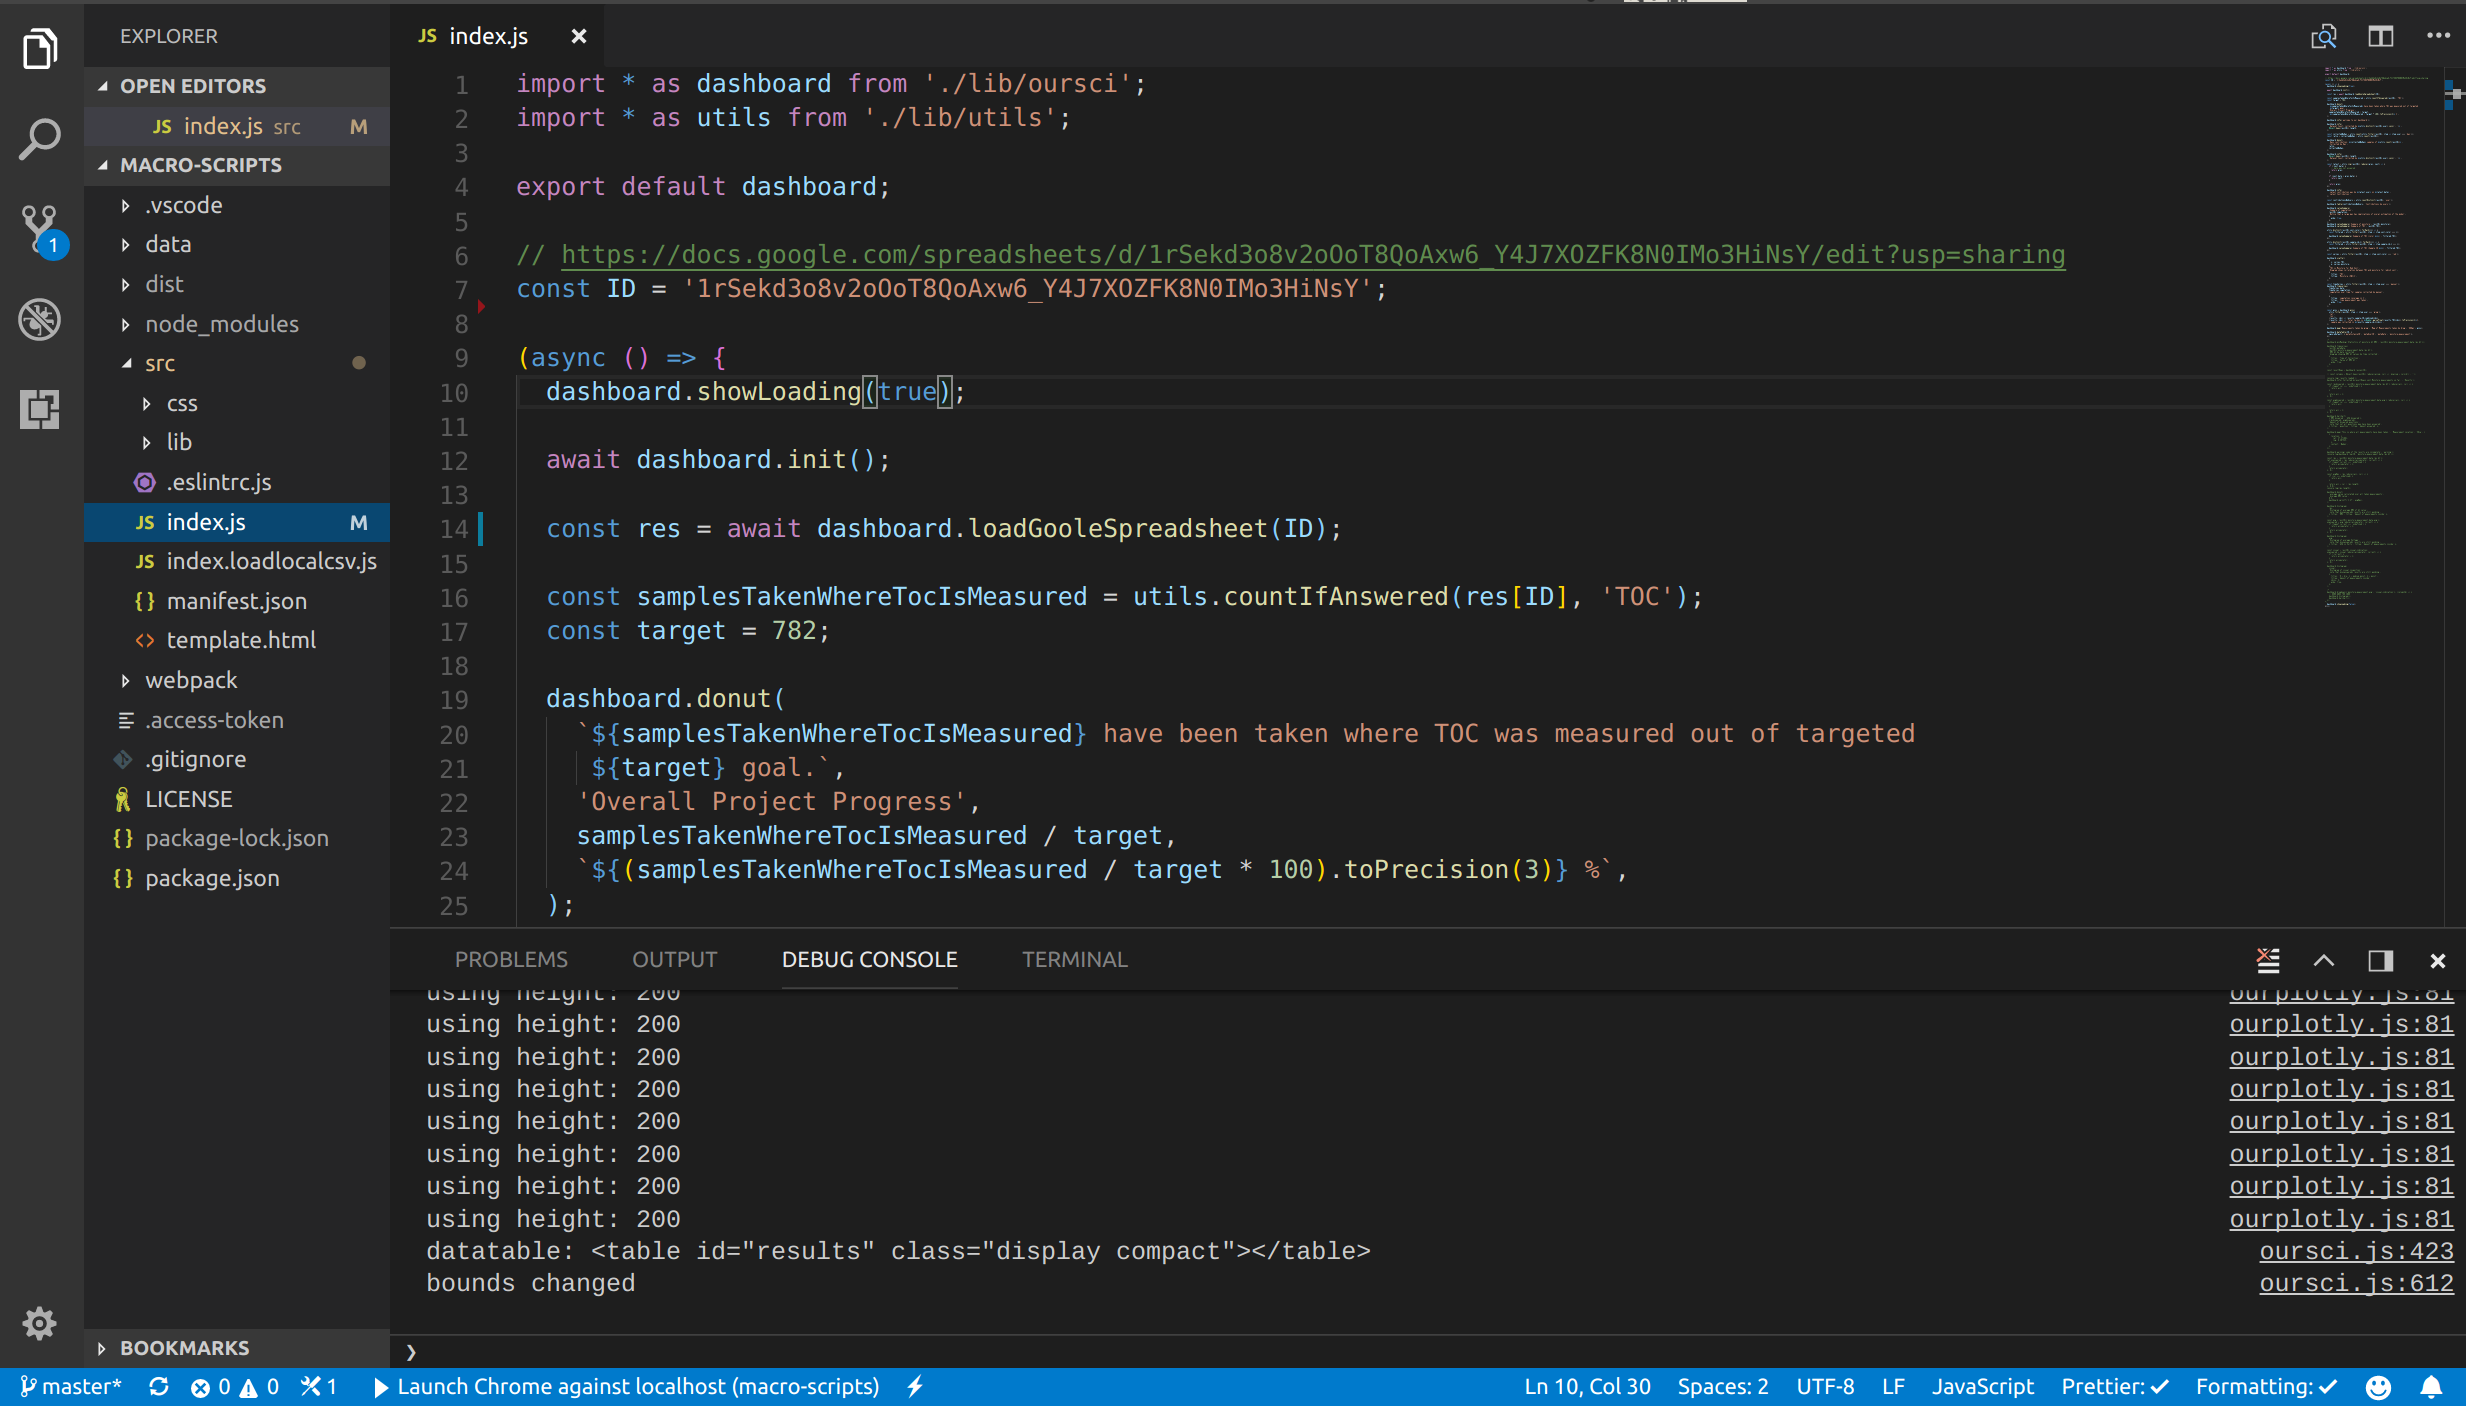
The first iteration of the flexible data visualization is ready for testing and available in the repo over at gitlab
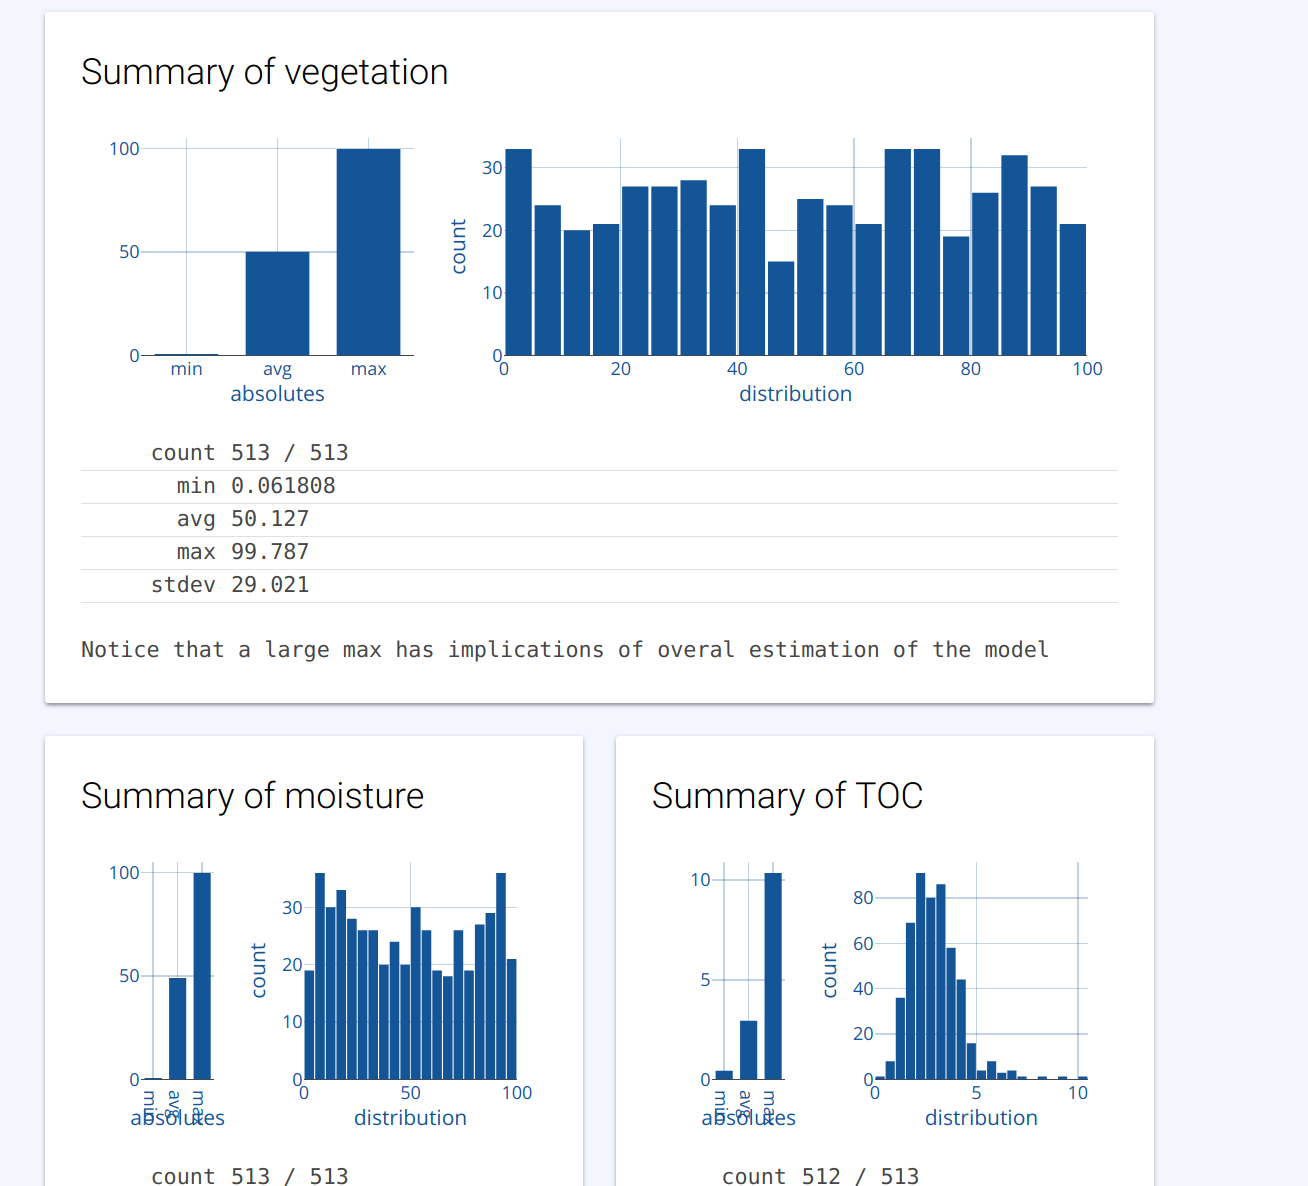
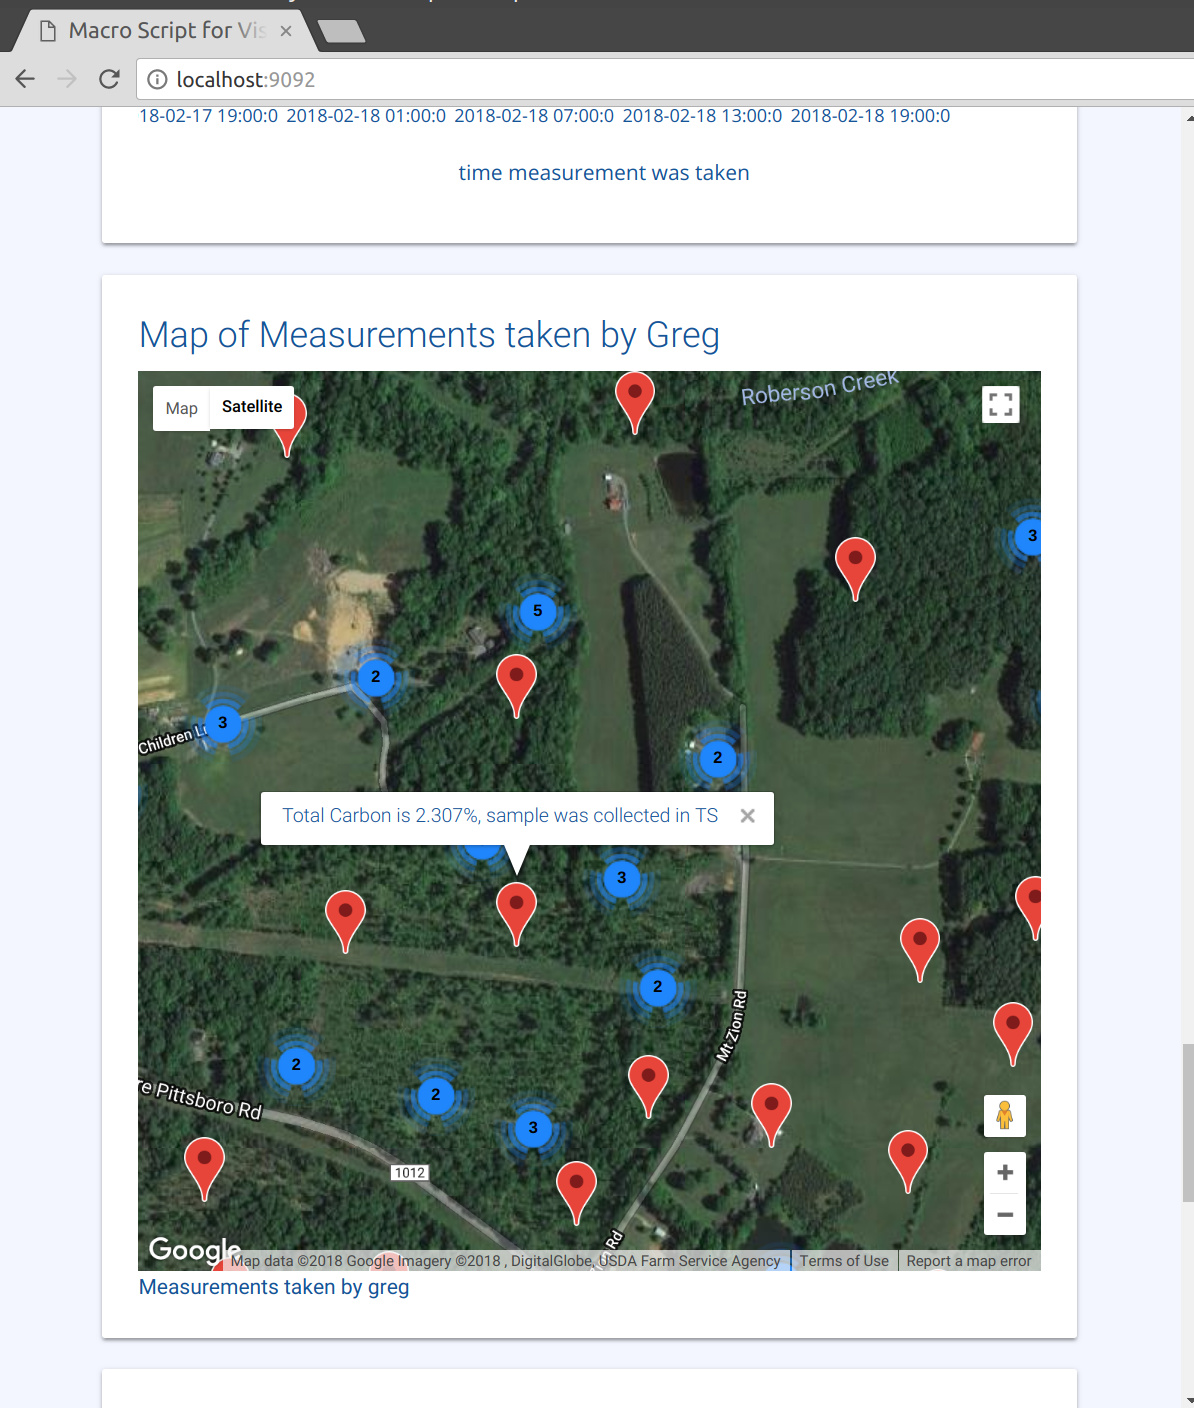
For a live demo check out an example with soil data pulled from Google Sheets.
There are a couple of examples to get started in the gitlab repo, which will show how to build a Dashboard in a very simple manner.
Also there are instructions how to pull data from
- a survey from our-sci
- google sheets public link
- local CSV sheet
Feedback is very welcome, the more testing we get, the better we know how to extend the base library to allow for building more meaningful dashboards.
To get started developing the only prerequisite is a NodeJS installation and a code editor of your choice (we are using vs code for development and built in some shortcuts to build, but everything is accessible just from command line with npm / nodejs).
Manuel